Churn, or the loss of customers from a company’s customer base, is a critical metric for businesses with recurring revenue streams. Understanding why customers leave and predicting future churn is essential for effective customer relationship management. This report focuses on a predictive churn analysis based on the Telco Churn dataset.
The Telco Churn dataset is commonly used in the field of customer churn analysis. It contains information about a telecommunications company’s customers and their behavior, including whether they churned.
This report showcases a predictive churn analysis using the Telco Churn demo dataset. It presents the results of the analysis and provides examples of insights to minimize customer churn. The focus of the analysis is to help companies identify customers who are at risk of leaving and take proactive steps to retain them.
Churn Overview for the Company
The following stacked bar chart displays the overall churn rate, calculated as the ratio of customers who have churned over the total number of customers.
It provides a visual representation of the company’s churn performance, making it easy to understand the magnitude of the problem at a glance.
Code
ml$charts$overall_churn
The predictive model
In this report, a machine learning technique known as Gradient Boosting Machines (GBM) was trained to develop a predictive model for customer churn.
The goal of the model is to identify customers who are at risk of leaving, so that the company can take action to retain them.
Gradient Boosting Machines (GBM) is a machine learning technique used to create predictive models. It is an ensemble method that combines multiple weak models to form a strong model for prediction. This technique is widely used for a variety of applications, including customer churn prediction, as it can handle complex relationships between variables and capture non-linear patterns in data.
Variables importance
This subsection displays a chart that shows the relative importance of each predictor variable in the GBM model. The chart provides a visual representation of how each variable contributes to the model’s prediction.
The variables are ranked based on their importance, with the most important variable listed first. This information is useful in understanding which variables have the greatest impact on customer churn, so that the company can focus its efforts on addressing these drivers.
We can also measure the isolated impact of the variables the company can apply new actions when trying to reduce Churn.
Based on the chart above, let’s say that the most important variables that the company can apply some actions to are:
Contract (e.g. plan improvements),
MonthlyCharges (e.g. reducing the fees with promotions),
TechSupport (e.g. improving support services),
PaymentMethod (e.g. offering new options or conditions).
Code
plot(grid_of_plots)
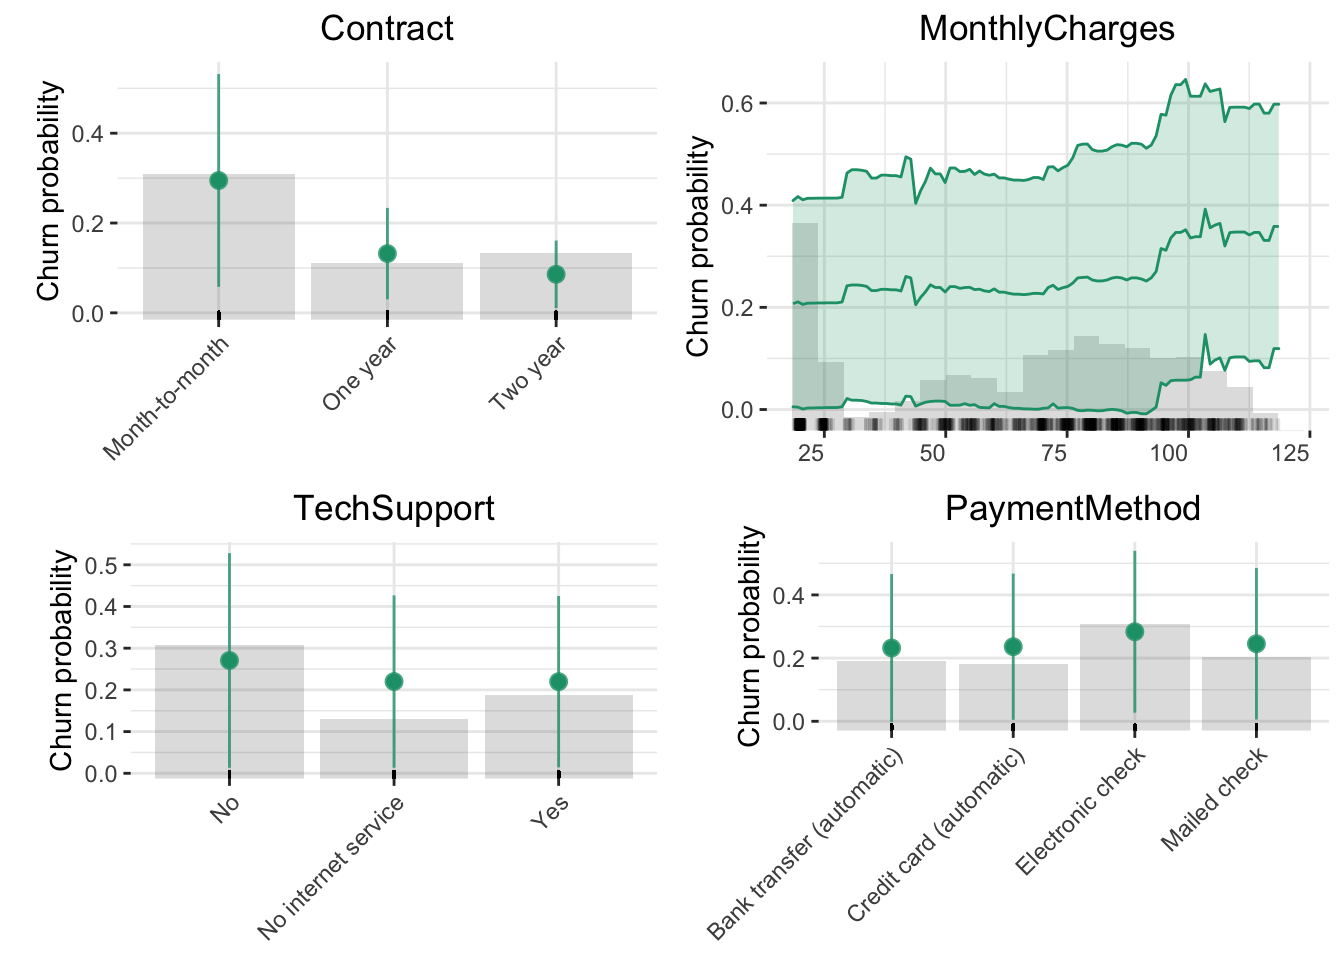
We could summarize some main points about the behavior of the churn rate among these variables:
Contract: churn probability is higher in month-to-month category.
MonthlyCharges: churn probability gets higher when the value is equal or greater than approximately 80%.
TechSupport: churn probability is higher when there is No tech support.
PaymentMethod: churn probability is higher in the groups that uses Eletronic check as payment method.
Customers to be prioritized with actions
In this section we are scoring the customers based on the risk of leaving the company. The results are shown in a chart that displays the probability of churn split into deciles.
The chart is a stacked column that compares the percentage of customers who churned versus those who did not. Additionally, a line represents the cumulative percentage of customers who churned. The main insights are as follows:
The first decile, which represents the customers with the highest risk of churn, has a churn rate of 74%, significantly higher than the overall churn rate of 26.54%.
From deciles 1 to 4, the churn rates are higher than the overall churn rate.
Decile 4 and below it include 78% of all customers who churned.
These insights highlight the importance of proactively targeting customers in the highest risk deciles to minimize churn.
Code
ml$charts$risk_groups_churn
Financial Implications of Customer Churn
In this section, we present a chart that showcases the distribution of monthly charges among different deciles of customers.
The chart presented here is similar to the previous one, but instead of percentages, each stacked column now represents the sum of monthly charges for each decile.
This analysis shows that the first decile contains the highest sum of monthly charges, which highlights an important insight:
the most critical customers in terms of risk to churn, are also the ones generating the most revenue for the company.
This information can help the company prioritize its retention efforts and target its high-value customers effectively.
Code
ml$charts$charge_for_risk_groups
Data with Predictive Results
This section presents a table containing test data with corresponding predictions. The table provides a clear comparison between actual customer churn and the model’s predictions.
Additionally, a download button is provided to export the data as an Excel spreadsheet, making it easy to analyze and share the results.
The insights generated in this report provide a valuable starting point for churn analysis. However, there is still room for improvement. Here are a few areas to consider for future work:
Feature selection process: Adding a feature selection process can help to determine which variables have the greatest impact on churn and should be prioritized in the model.
Detailed variable impact analysis: Expanding the understanding of how individual variables impact churn can help to fine-tune the model and improve its accuracy.
Periodic model updates: Implementing a process to periodically update the model and generate new predictions every month can help to ensure that the insights generated are always up-to-date and relevant.
Overall, these next steps can help to deepen the understanding of customer churn and drive more informed business decisions.
Future Recommendations
There are some action plans that can be taken based on the insights from the predictive churn analysis.
Action plan based on risk deciles: Identify customers who are at the highest risk of churning and prioritize them for targeted interventions.
Customer segmentation: Divide customers into different segments based on the factors that contribute to their churn risk. This will help in developing customized strategies for each segment.
Address key drivers: Focus on the key drivers of customer churn and implement measures to address them. This could be through improving the customer experience, enhancing product features, or providing more personalized support.
Monitor and evaluate: Regularly monitor the effectiveness of the actions taken and evaluate their impact on customer churn. This will help in making informed decisions and continuously improving the strategies.
Conclusion
This study provides a comprehensive overview of churn analysis for the company, including a predictive model using gradient boosting, an assessment of variable importance, and a financial overview of the customers at risk of churning, as well as suggestions for next steps to further improve the insights generated.
Source Code
---title: "Predictive Customer Churn Analysis"author: "Wlademir Ribeiro Prates"date: "2023-02-08"categories: [Reporting, Data Science, Machine Learning]image: preview.pngformat: html: include-after-body: disqus.html---```{r}#| warning: false#| message: false#| echo: false#| include: falselibrary(downloadthis)library(dplyr)library(gridExtra)library(h2o)library(highcharter)library(readr)library(reactable)# Preparing objectsml <-list()colors <-c("#e8e9ed", "#e89978", "#4a57a6", "#4192b5")# Start h2o clusterh2o::h2o.init()# Reading the dataml$data$raw <- readr::read_csv("https://raw.githubusercontent.com/wrprates/open-data/master/telco_customer_churn.csv") |> dplyr::mutate(across(where(is.character), as.factor))# Defining variablesml$vars$y <-"Churn"ml$vars$discard <-"customerID"ml$vars$x <-setdiff(names(ml$data$raw), c(ml$vars$y, ml$vars$discard))# Setup h2oml$data$h2o <- h2o::as.h2o(ml$data$raw)ml$data$splits <- h2o::h2o.splitFrame(ml$data$h2o, ratios =0.7)names(ml$data$splits) <-c("train", "test")# Running the modelml$model <- h2o::h2o.gbm(x = ml$vars$x, y = ml$vars$y, training_frame = ml$data$splits$train)ml$predictions <- h2o::h2o.predict(ml$model, ml$data$splits$test)h2o::h2o.performance(ml$model, ml$data$splits$test)ml$data$predictions <- ml$data$splits$test |> tibble::as_tibble() |> dplyr::bind_cols( dplyr::as_tibble(ml$predictions) |> dplyr::select(Predict = predict, PredictProbability = Yes) |> dplyr::mutate(PredictProbability =round(100*PredictProbability, 2)) ) |># 11 is not a magic number, it is inverting the order of the deciles dplyr::mutate(RiskGroup =as.factor(11- dplyr::ntile(PredictProbability, 10))) |> dplyr::select(customerID, Churn, Predict, PredictProbability, RiskGroup, dplyr::everything()) |> dplyr::arrange(dplyr::desc(PredictProbability))# Overall Churnml$data$overall_churn <- ml$data$raw |> dplyr::group_by(Churn) |> dplyr::tally() |> dplyr::mutate(`% Customers`=round(100* n /sum(n), 2),Customer ="Churn Yes / No" ) |> dplyr::rename(`Count Customers`= n)ml$charts$overall_churn <- ml$data$overall_churn |> highcharter::hchart(hcaes(x = Customer, y =`% Customers`, group = Churn),type ="bar",stacking ="normal",dataLabels =list(enabled =TRUE) ) |> highcharter::hc_title(text ="Overall company's Churn") |> highcharter::hc_size(width =NULL, height =200) |> highcharter::hc_xAxis(title =list(text ="")) |> highcharter::hc_yAxis(max =100) |> highcharter::hc_colors(colors)# Variables importanceml$vars$importance <- h2o::h2o.varimp(ml$model) |> tibble::as_tibble()ml$charts$vars_importance <- highcharter::highchart() |> highcharter::hc_add_series(ml$vars$importance$percentage*100, name ="") |> highcharter::hc_chart(type ="bar") |> highcharter::hc_xAxis(categories = ml$vars$importance$variable) |> highcharter::hc_yAxis(title =list(text ="Importance Percentage"), labels =list(format ="{value}%") ) |> highcharter::hc_chart(zoomType ="xy") |> highcharter::hc_colors(colors[4]) |> highcharter::hc_legend(enabled =FALSE) |> highcharter::hc_tooltip(formatter =JS("function(){return 'Importance (%): <b>' + Highcharts.numberFormat(this.y) + '%</b>';}" ),useHTML =FALSE ) |> highcharter::hc_title(text ="Variables Importance") |> highcharter::hc_size(width =NULL, height =500)# Calculates active and canceled customers and cumulative canceled for each decileml$data$chrun_by_risk_groups <- ml$data$predictions |> dplyr::group_by(RiskGroup, Churn) |> dplyr::tally() |> dplyr::mutate(prop =100* n /sum(n)) |> dplyr::ungroup() |> dplyr::group_by(Churn) |> dplyr::mutate(prop_bad_good =100* n /sum(n),cum_prop =cumsum(prop_bad_good),n_cum_sum =cumsum(n)) |> dplyr::ungroup() |> dplyr::group_by(RiskGroup) |> dplyr::mutate(precisao =100* n_cum_sum /sum(n_cum_sum)) |> dplyr::ungroup() |> dplyr::mutate(across(.cols =c("prop", "prop_bad_good", "cum_prop", "precisao"), .fns = round, 2 ))# Chart with risk groups by decilesml$charts$risk_groups_churn <- ml$data$chrun_by_risk_groups |> highcharter::hchart(hcaes(x = RiskGroup, y = prop, group = Churn), type ="column") |> highcharter::hc_add_series(name="Cumulative % of canceled customers (recall)",data = (ml$data$chrun_by_risk_groups %>% dplyr::filter(Churn =="Yes"))$cum_prop,type ="line",dashStyle ="DashDot",opposite =FALSE,dataLabels =list(enabled =TRUE,color ="#666",style =list(fontSize ="16px"),formatter =JS("function () {if(this.y===0){return null;} return Math.round( this.y ) + '%'; }") ) ) |> highcharter::hc_yAxis(title =list(text ="Proportion (%)"), max =100) |> highcharter::hc_xAxis(title =list(text ="Risk Group")) |> highcharter::hc_colors(colors) |> highcharter::hc_plotOptions(column =list(stacking ="normal",dataLabels =list(enabled =TRUE,color ="black",style =list(fontSize ="17px"),formatter =JS("function () { if(this.y===0){return null;} return Math.round(100 * this.y / this.total) + '%'; }") ) )) |> highcharter::hc_tooltip(table =FALSE,shared =TRUE,split =FALSE,headerFormat ="<span style='font-size: 14px'>{point.key}</span><br/>",pointFormat ="<span style='font-size: 22px; color:{point.color}'>\u25CF</span> <span style='font-size: 16px;'>{series.name}:</span> <span style='font-size: 16px; font-weight: bold;'>{point.y}</span> <br/>" ) |> highcharter::hc_title(text ="Churn by Group Risk and cumulative canceled customers")# Chart with financial values for each decileml$data$charge_for_risk_groups <- ml$data$predictions |> dplyr::group_by(Churn, RiskGroup) |> dplyr::summarise(SumMonthlyCharges =sum(MonthlyCharges, na.rm =TRUE), .groups ="drop")ml$charts$charge_for_risk_groups <- ml$data$charge_for_risk_groups |> highcharter::hchart(hcaes(x = RiskGroup, y = SumMonthlyCharges, group = Churn), type ="column") |> highcharter::hc_plotOptions(column =list(stacking ="normal",dataLabels =list(enabled =TRUE,color ="black",style =list(fontSize ="17px"),formatter =JS("function () { if(this.y===0){return null;} return Math.round(this.y / 1000) + 'k'; }") ) )) |> highcharter::hc_yAxis(title =list(text ="Monthly Charges ($)")) |> highcharter::hc_xAxis(title =list(text ="Risk Group")) |> highcharter::hc_colors(colors) |> highcharter::hc_title(text ="Total Monthly Charges by Risk Group (probability deciles)") ```Churn, or the **loss of customers from a company's customer base**, is a **critical metric** for businesses with **recurring revenue streams**. Understanding why customers leave and **predicting future churn** is essential for effective **customer relationship management**. This report focuses on a **predictive churn analysis** based on the Telco Churn dataset.> The [Telco Churn dataset](https://www.kaggle.com/datasets/blastchar/telco-customer-churn) is commonly used in the field of customer churn analysis. It contains information about a telecommunications company's customers and their behavior, including whether they churned.This report showcases a predictive churn analysis using the Telco Churn demo dataset. It presents the results of the analysis and provides **examples of insights to minimize customer churn**. The focus of the analysis is **to help companies identify customers who are at risk of leaving and take proactive steps to retain them**.## Churn Overview for the CompanyThe following stacked bar chart displays the **overall churn rate**, calculated as the ratio of customers who have churned over the total number of customers.It provides a visual representation of the company's churn performance, making it **easy to understand the magnitude of the problem at a glance**.```{r}ml$charts$overall_churn```## The predictive modelIn this report, a **machine learning** technique known as **Gradient Boosting Machines (GBM)** was trained to develop a predictive model for customer churn.The goal of the model is to **identify customers who are at risk of leaving**, so that the company can take action to retain them.> Gradient Boosting Machines (GBM) is a machine learning technique used to create predictive models. It is an ensemble method that combines multiple weak models to form a strong model for prediction. This technique is widely used for a variety of applications, including customer churn prediction, as it can handle complex relationships between variables and capture non-linear patterns in data.### Variables importanceThis subsection displays a chart that shows the relative importance of each predictor variable in the GBM model. The chart provides a visual representation of how each variable contributes to the model's prediction. The variables are ranked based on their importance, with **the most important variable listed first**. This information is useful in **understanding which variables have the greatest impact on customer churn**, so that the company can **focus its efforts** on addressing these drivers.```{r, echo=FALSE}ml$charts$vars_importance```We can also measure the isolated impact of the **variables the company can apply new actions** when trying to reduce Churn.Based on the chart above, let's say that the most important variables that the company can apply some actions to are:- `Contract` (e.g. plan improvements),- `MonthlyCharges` (e.g. reducing the fees with promotions),- `TechSupport` (e.g. improving support services),- `PaymentMethod` (e.g. offering new options or conditions).```{r}#| include: falseplots_list <- purrr::map(c("Contract", "MonthlyCharges", "TechSupport", "PaymentMethod"),~ h2o::h2o.pd_plot(object = ml$model,newdata = ml$data$splits$test,column = .x ) + ggplot2::theme(legend.position ="none",axis.title.x = ggplot2::element_blank(),panel.border = ggplot2::element_blank(),panel.background = ggplot2::element_blank() ) + ggplot2::ggtitle(.x) + ggplot2::labs(y ="Churn probability"))grid_of_plots <-do.call( gridExtra::arrangeGrob,c(lapply(plots_list, plot), ncol =2, nrow =2))``````{r}plot(grid_of_plots)```We could summarize some main points about the behavior of the churn rate among these variables:- `Contract`: churn probability is higher in `month-to-month` category.- `MonthlyCharges`: churn probability gets higher when the value is equal or greater than approximately 80%.- `TechSupport`: churn probability is higher when there is `No` tech support.- `PaymentMethod`: churn probability is higher in the groups that uses `Eletronic check` as payment method.## Customers to be prioritized with actionsIn this section we are scoring the customers based on the risk of leaving the company. The results are shown in a chart that displays the probability of churn split into deciles.The chart is a stacked column that compares the percentage of customers who churned versus those who did not. Additionally, a line represents the cumulative percentage of customers who churned. The main insights are as follows:- The first decile, which represents the **customers with the highest risk of churn**, has a churn rate of **74%**, significantly higher than the overall churn rate of 26.54%.- From **deciles 1 to 4**, the churn rates are **higher than the overall churn** rate.- Decile 4 and below it include **78% of all customers who churned**.**These insights highlight the importance of proactively targeting customers in the highest risk deciles to minimize churn.**```{r}ml$charts$risk_groups_churn```## Financial Implications of Customer ChurnIn this section, we present a chart that showcases the distribution of monthly charges among different deciles of customers. The chart presented here is similar to the previous one, but instead of percentages, each stacked column now represents the sum of monthly charges for each decile.This analysis shows that **the first decile contains the highest sum of monthly charges**, which highlights an important insight:> the most critical customers in terms of risk to churn, are also the ones generating the most revenue for the company.This information can help the company prioritize its retention efforts and target its high-value customers effectively.```{r}ml$charts$charge_for_risk_groups```## Data with Predictive ResultsThis section presents a table containing test data with corresponding predictions. The table provides a clear comparison between actual customer churn and the model's predictions.Additionally, a download button is provided to export the data as an Excel spreadsheet, making it easy to analyze and share the results.```{r}ml$data$predictions |> reactable::reactable(columns =list(`Contract`=colDef(minWidth =150),`PaymentMethod`=colDef(minWidth =150) ),highlight =TRUE,striped =FALSE,filterable =TRUE,searchable =FALSE,compact =TRUE,borderless =TRUE,defaultPageSize =7 )``````{r}downloadthis::download_this( ml$data$predictions,button_label ="Download predictions",output_name ="customer_churn_prediction",output_extension =".xlsx",button_type ="default")```## Technical Next StepsThe insights generated in this report provide a valuable starting point for churn analysis. However, there is still room for improvement. Here are a few areas to consider for future work:- **Feature selection process**: Adding a feature selection process can help to determine which variables have the greatest impact on churn and should be prioritized in the model.- **Detailed variable impact analysis**: Expanding the understanding of how individual variables impact churn can help to fine-tune the model and improve its accuracy.- **Periodic model updates**: Implementing a process to periodically update the model and generate new predictions every month can help to ensure that the insights generated are always up-to-date and relevant.Overall, these next steps can help to deepen the understanding of customer churn and drive more informed business decisions.## Future RecommendationsThere are some action plans that can be taken based on the insights from the predictive churn analysis.- **Action plan based on risk deciles**: Identify customers who are at the highest risk of churning and prioritize them for targeted interventions.- **Customer segmentation**: Divide customers into different segments based on the factors that contribute to their churn risk. This will help in developing customized strategies for each segment.- **Address key drivers**: Focus on the key drivers of customer churn and implement measures to address them. This could be through improving the customer experience, enhancing product features, or providing more personalized support.- **Monitor and evaluate**: Regularly monitor the effectiveness of the actions taken and evaluate their impact on customer churn. This will help in making informed decisions and continuously improving the strategies.## ConclusionThis study provides a comprehensive overview of churn analysis for the company, including a predictive model using gradient boosting, an assessment of variable importance, and a financial overview of the customers at risk of churning, as well as suggestions for next steps to further improve the insights generated.